GSTR-3B Filing Redesign
Product Designer · Clear (ClearTax) · 2022 – 2024
A moment after launch.
How we got there.
The lesson — and what I’d do differently.
In medias res
Into the middle of things.
The team celebrated.
I wasn't comfortable.
Three months in, I went back into the field.
Adoption ≠ Proficiency.
How we got here.
Phase 1 · Pre-launch.
The platform was anti-scale.
My team of six spends five full days every month filing for 120 registrations. We make mistakes because the process creates mistakes.
Sunita, CFO · Manufacturing Firm
120 registrations (GSTINs) · 5 days every month · 6-person team
Three patterns. Fifty interviews.
Multi-filing was the #1 pain for enterprises with 10+ registrations (GSTINs).
Of all support tickets were ITC reconciliation mismatches.
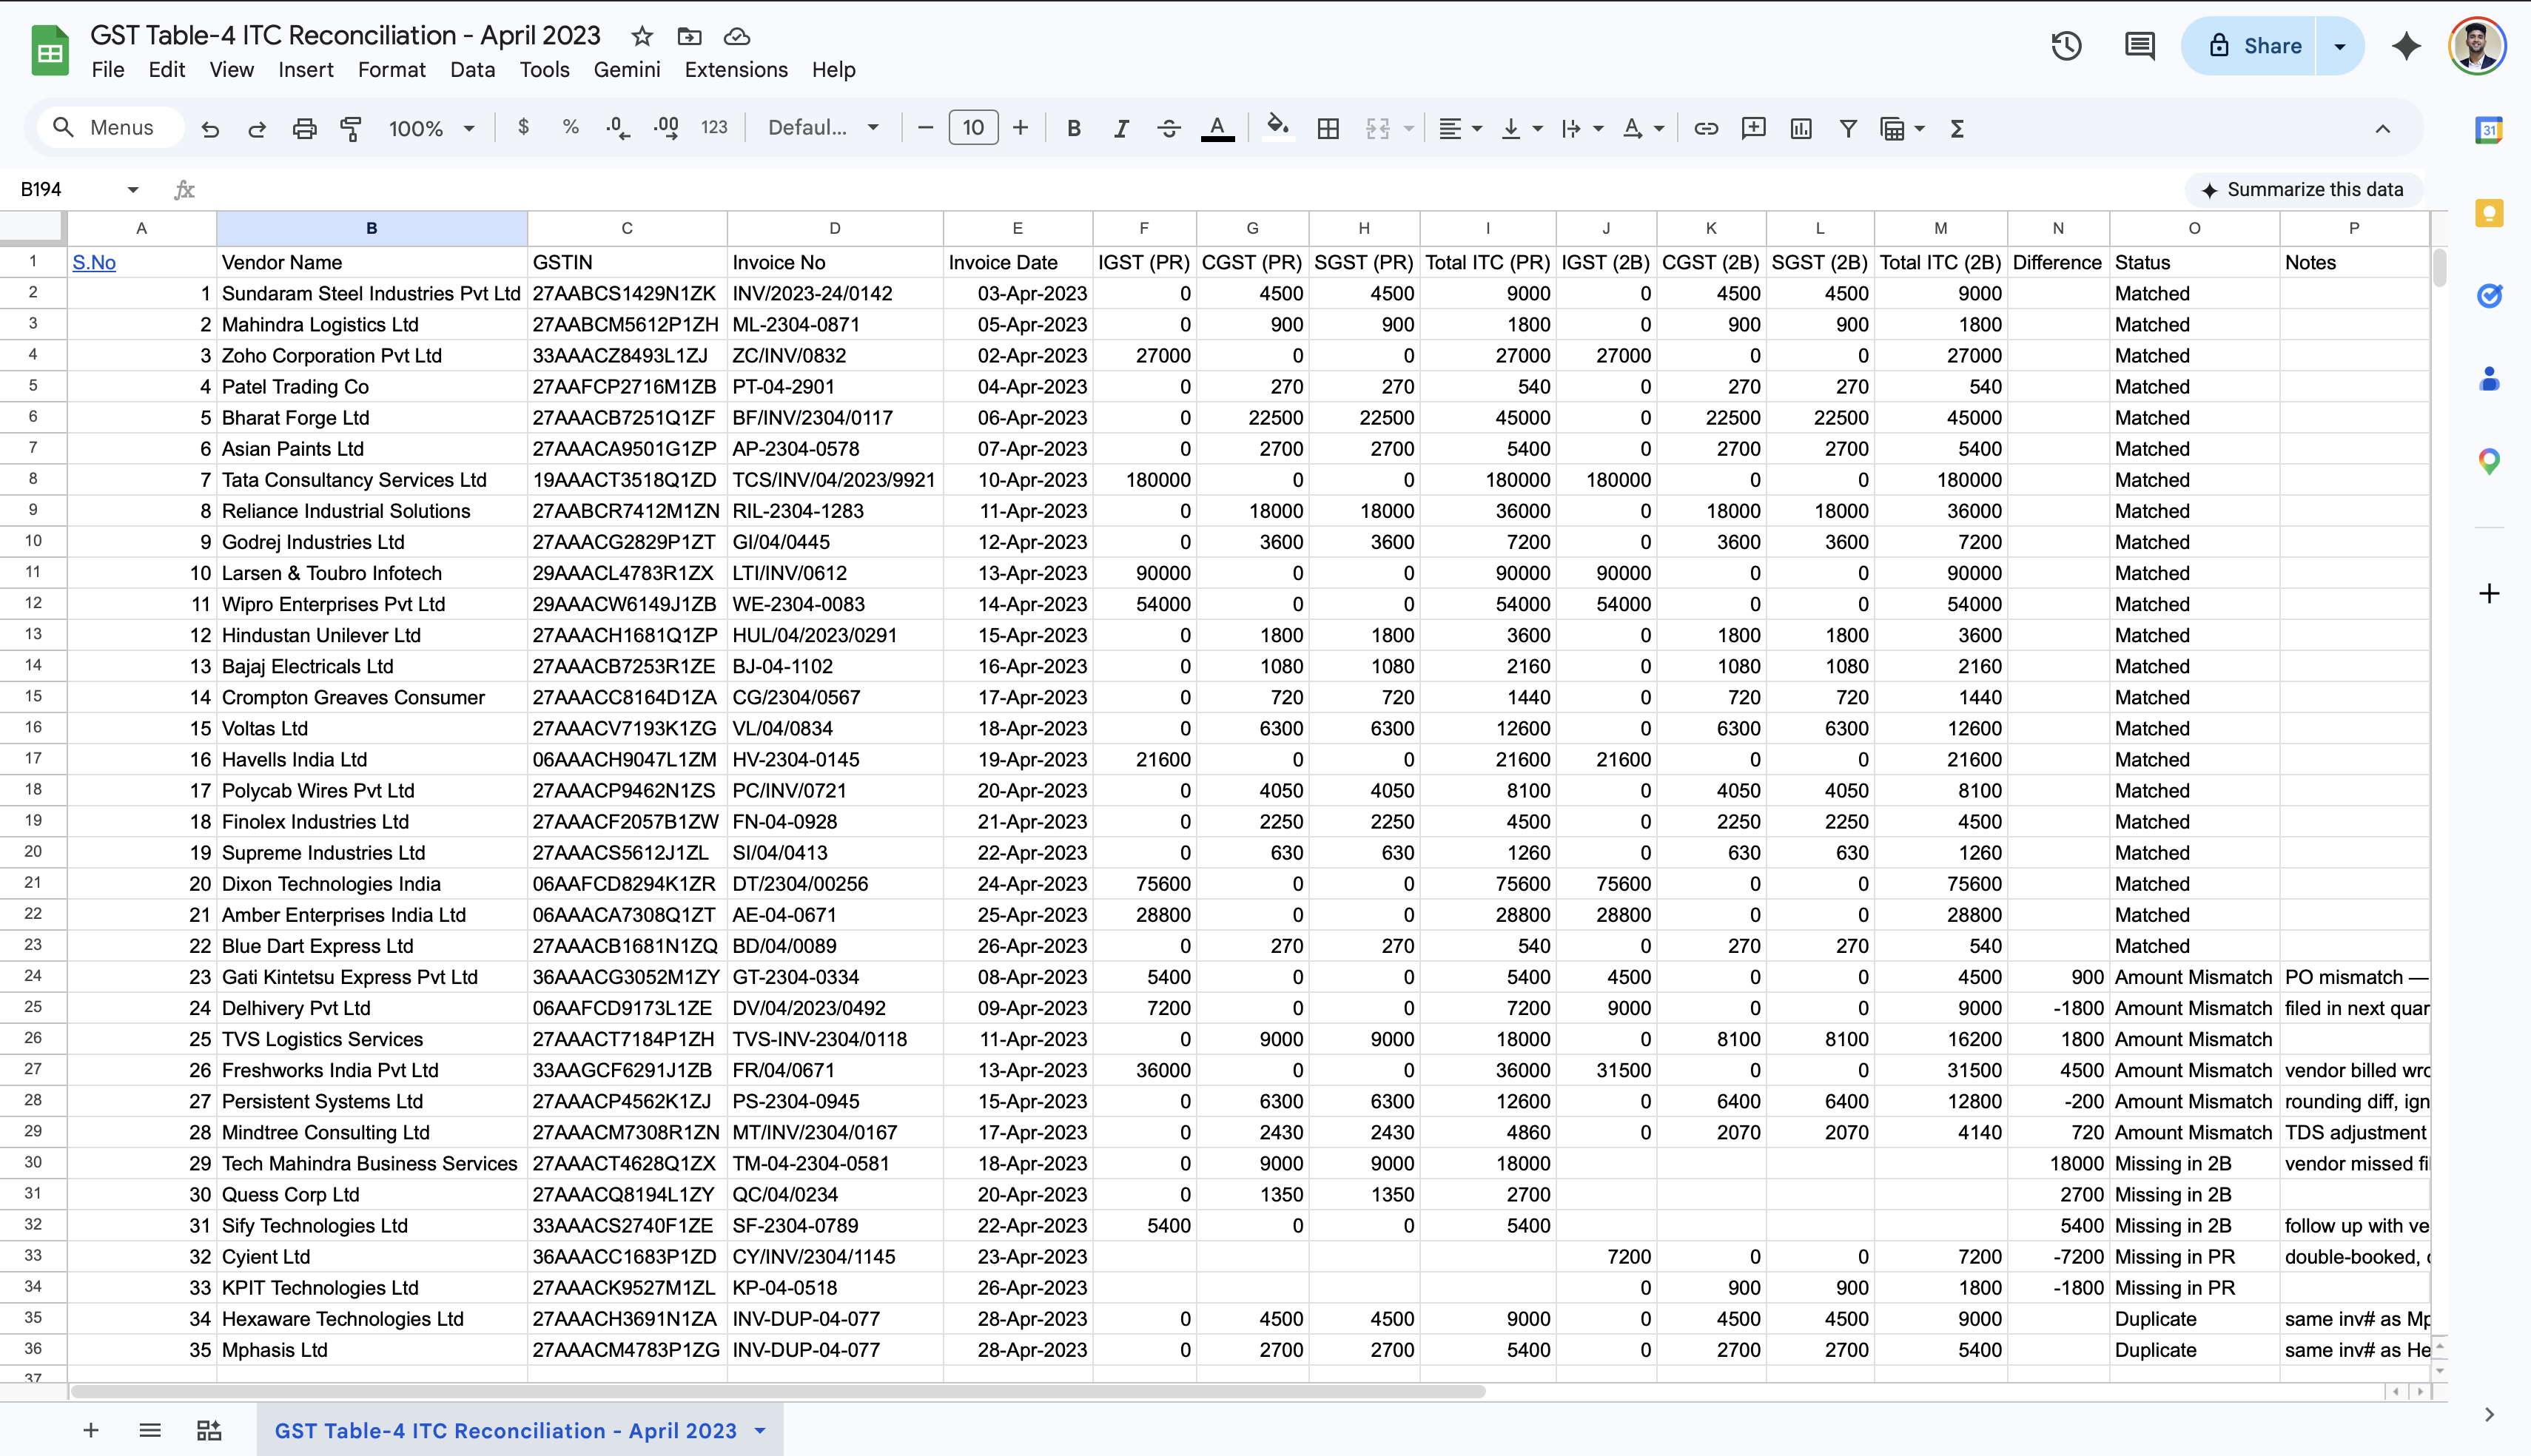
Of users were copying data into Excel pivot tables.
Three structural shifts.
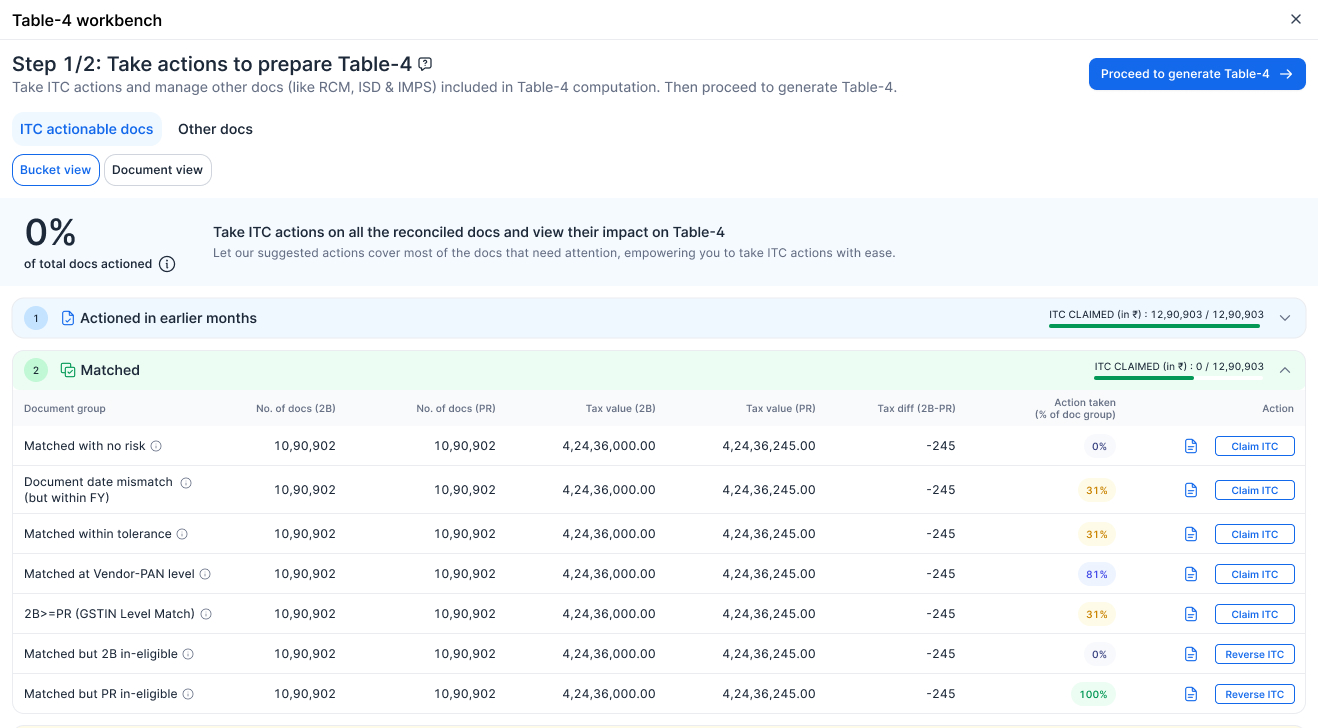
- 01 Batches, not singles. Multi-registration dashboard with batch actions.
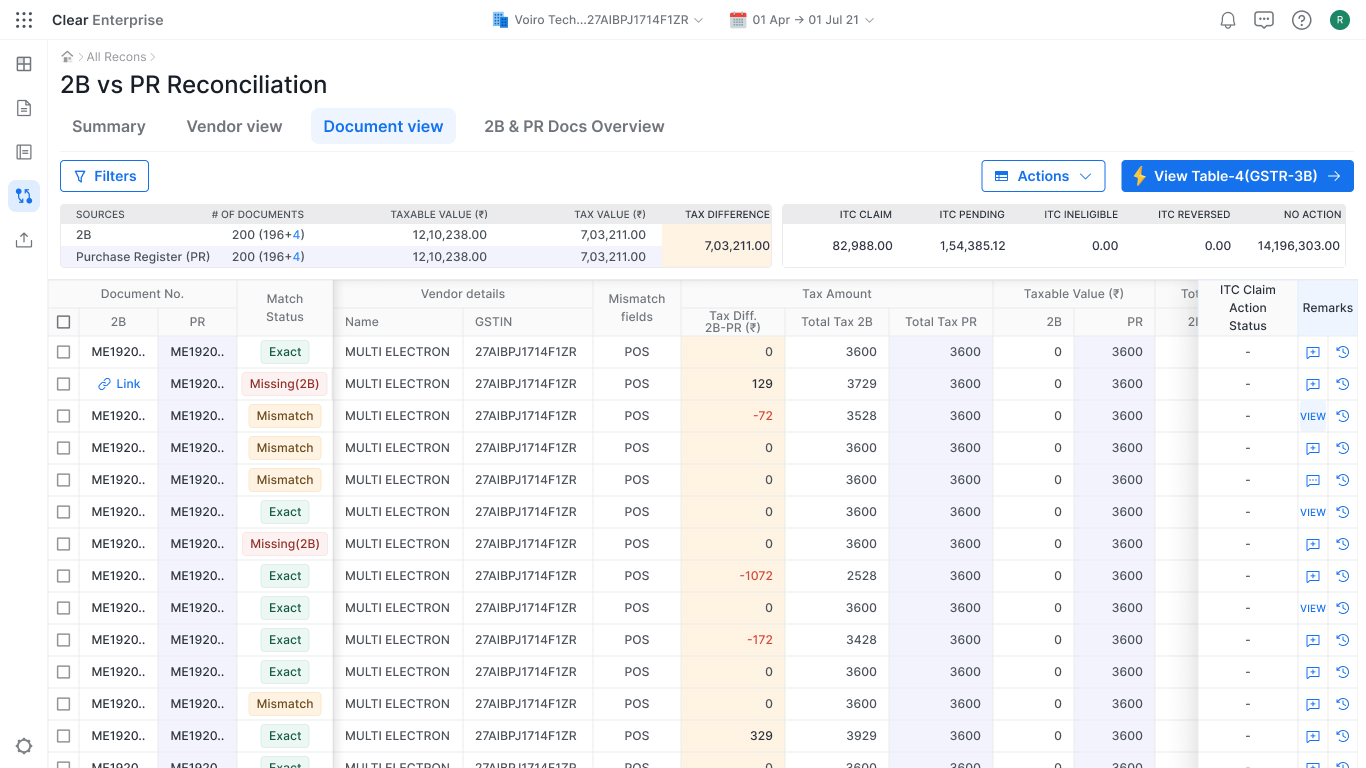
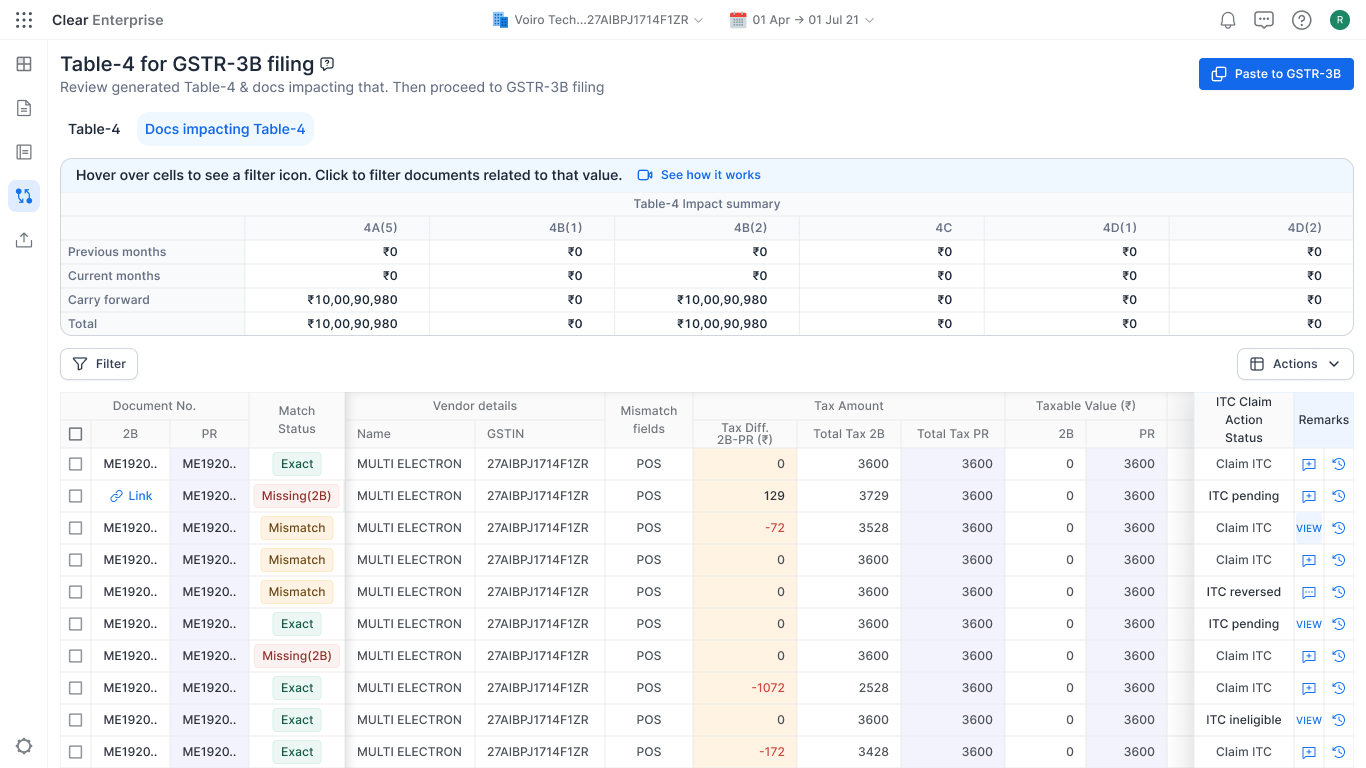
- 02 Recon in-product. Split-view engine. Excel becomes optional.
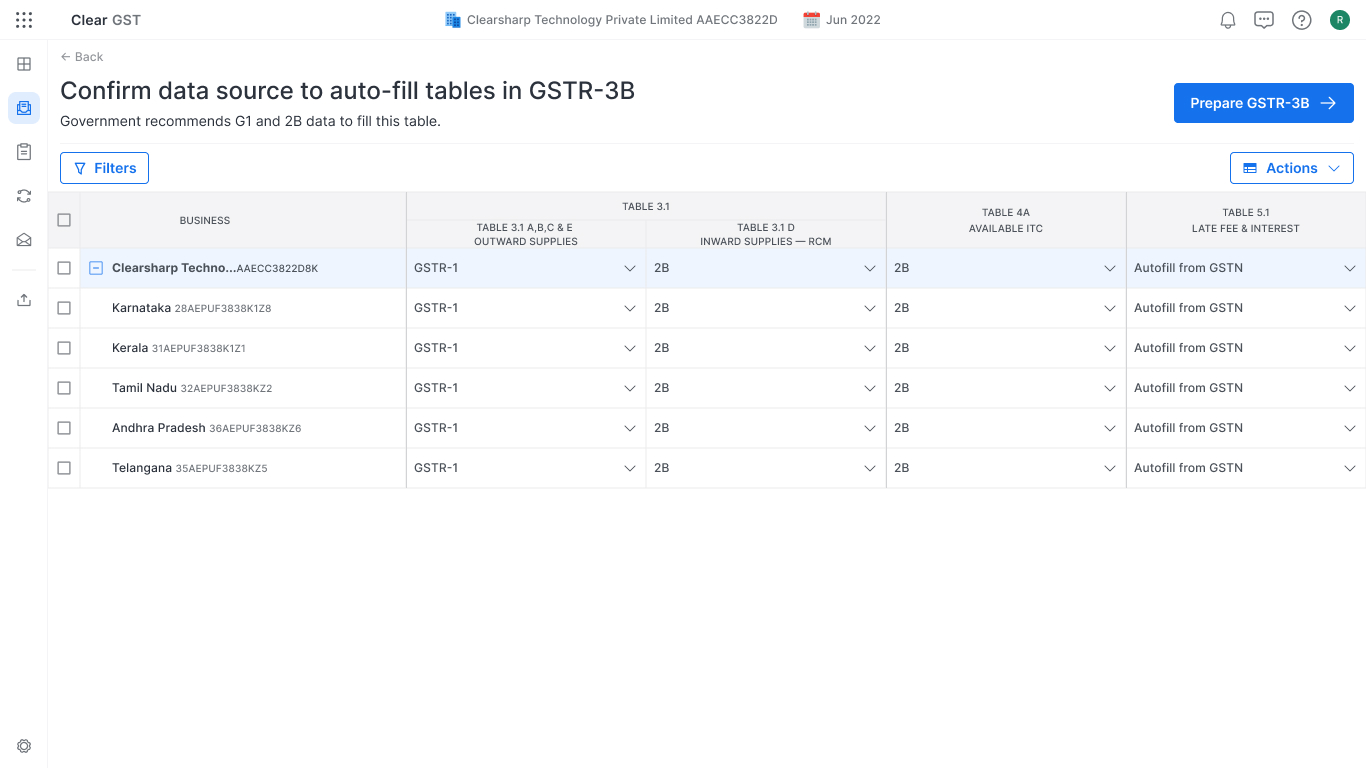
- 03 Configure once. Data sources reused across every registration.
We shipped.
On paper, a successful launch.
| 1.0 | 2.0 LAUNCH | |
|---|---|---|
| GSTR-3B adoption | 18% | 42% |
| Filing time per registration | 1 hour | < 10 min |
| Registrations per customer | 4–5 | 12–15 |
| CSM tickets / month | ~400 | ~350 |
Then I went back into the field.
The same field that opened this deck.
What the metrics couldn't see.
- 01 CSMs were doing tasks for users to mark them "active".
- 02 Excel was open during every filing.
- 03 The same blockers appeared every month, for the same users.
Used ≠ trusted.
Three surgical fixes.
None of them are big features.
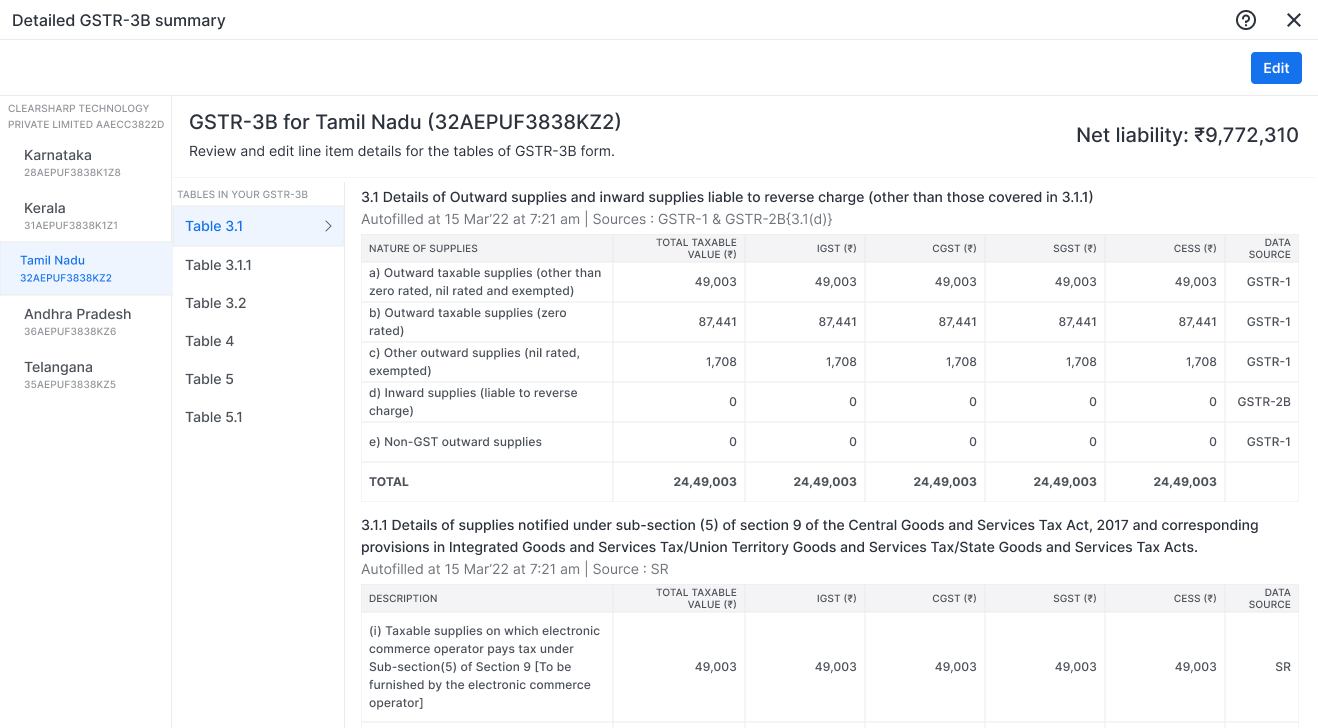
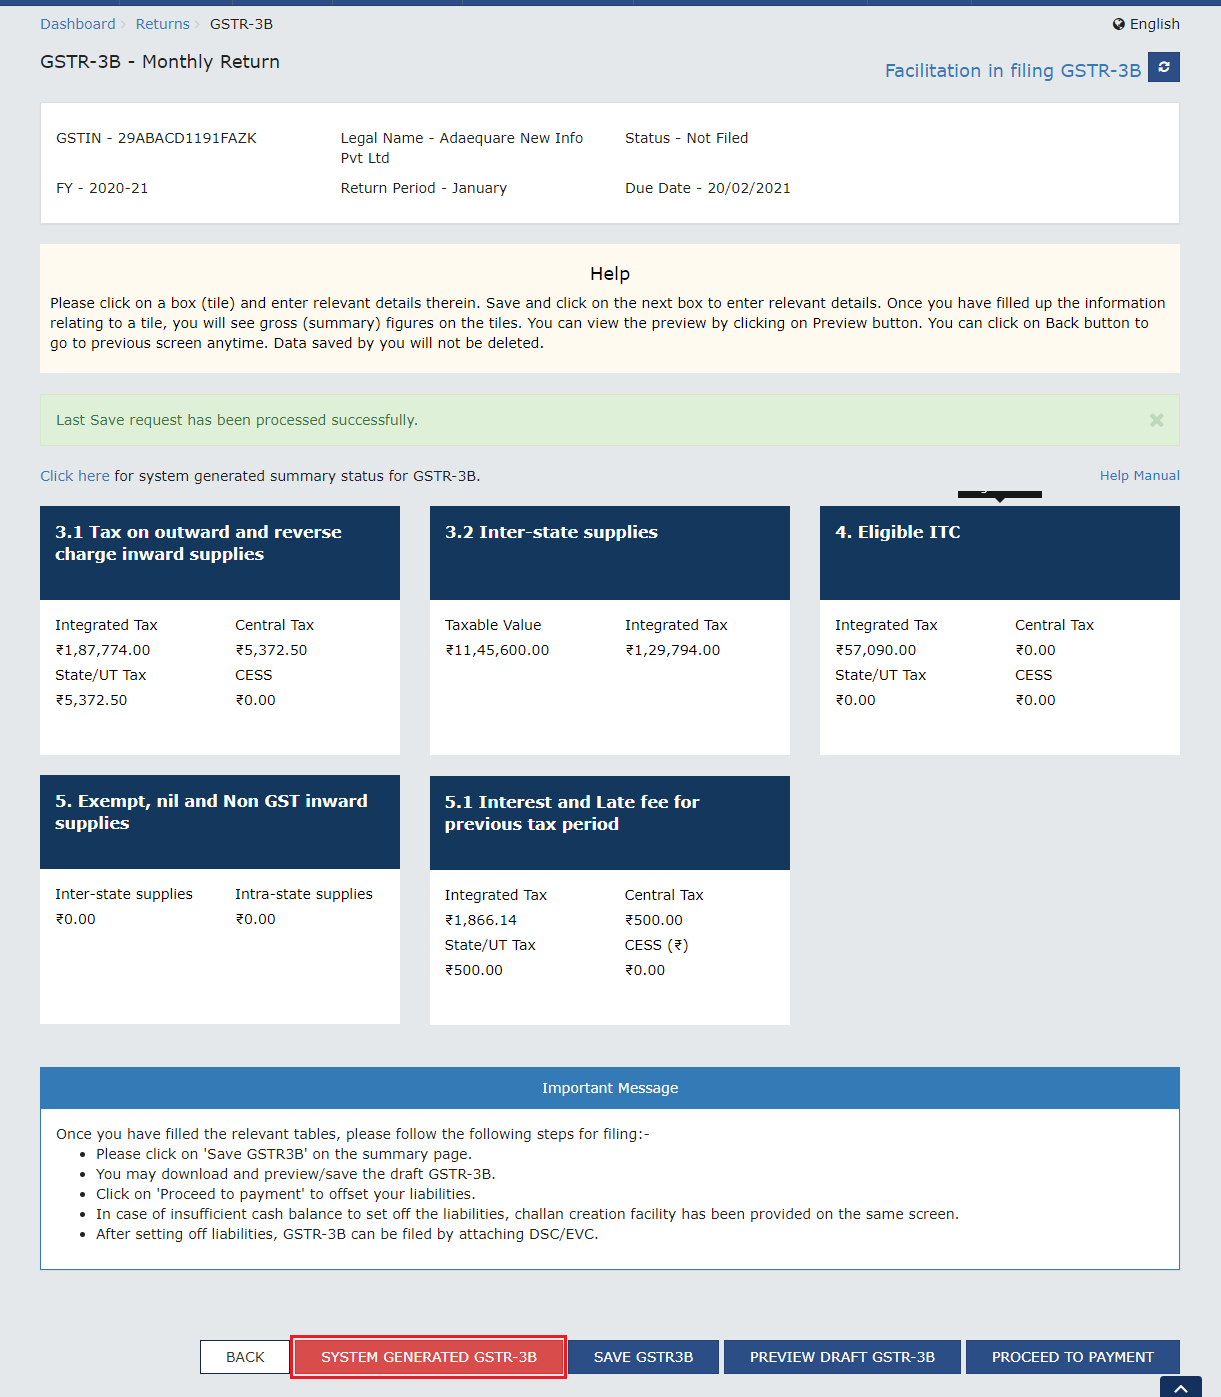
The live previews made Table-4 feel less like a mystery.
Meera, Tax Consultant · 30+ clients
Result.
Three columns. The third one counts.
| 1.0 | 2.0 LAUNCH | 2.0 POST-ITERATION | |
|---|---|---|---|
| GSTR-3B adoption | 18% | 42% | 53% |
| Filing time per registration | 1 hour | < 10 min | < 8 min |
| Registrations per customer | 4–5 | 12–15 | 12–15 |
| Reconciliation accuracy | 80% | 80–92% | 94% |
| CSM tickets / month | ~400 | ~350 | ~110 |
The launch column looks good.
The post-iteration column made the product real.
Adoption ≠ Proficiency.
The dashboards weren't lying. They were measuring the wrong thing.
What I'd do differently.
- 01 Bake the data funnel into design. Instrumentation as a first-class design output. The proficiency gap I caught in month three would surface in launch week.
- 02 Make Table-4 talkable, not just visible. A live preview made the math visible. Today, AI could explain why every number moved — in plain language. Glass becomes dialogue.
- 03 Make proficiency a launch criterion. "Shipped" should mean users complete the task without a CSM. We didn't have that bar. Next time, I'd write it before week one.
Thank you.
ashishkhoshya.com · linkedin.com/in/ashishkhoshya